Stalemate Strategies: Unearthing Statistical Edges in Mid-Table Football Draws
The Rise of Draw Betting in Balanced Battles
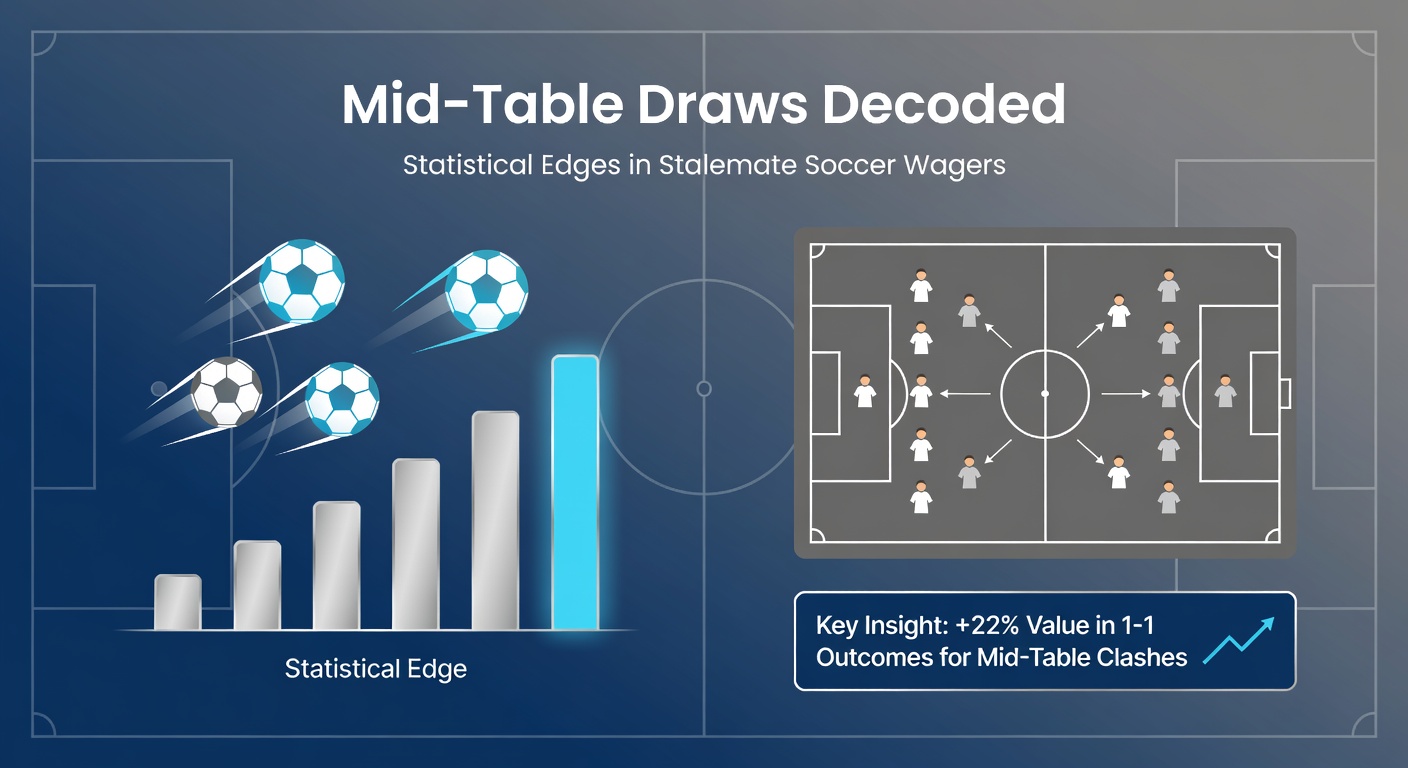
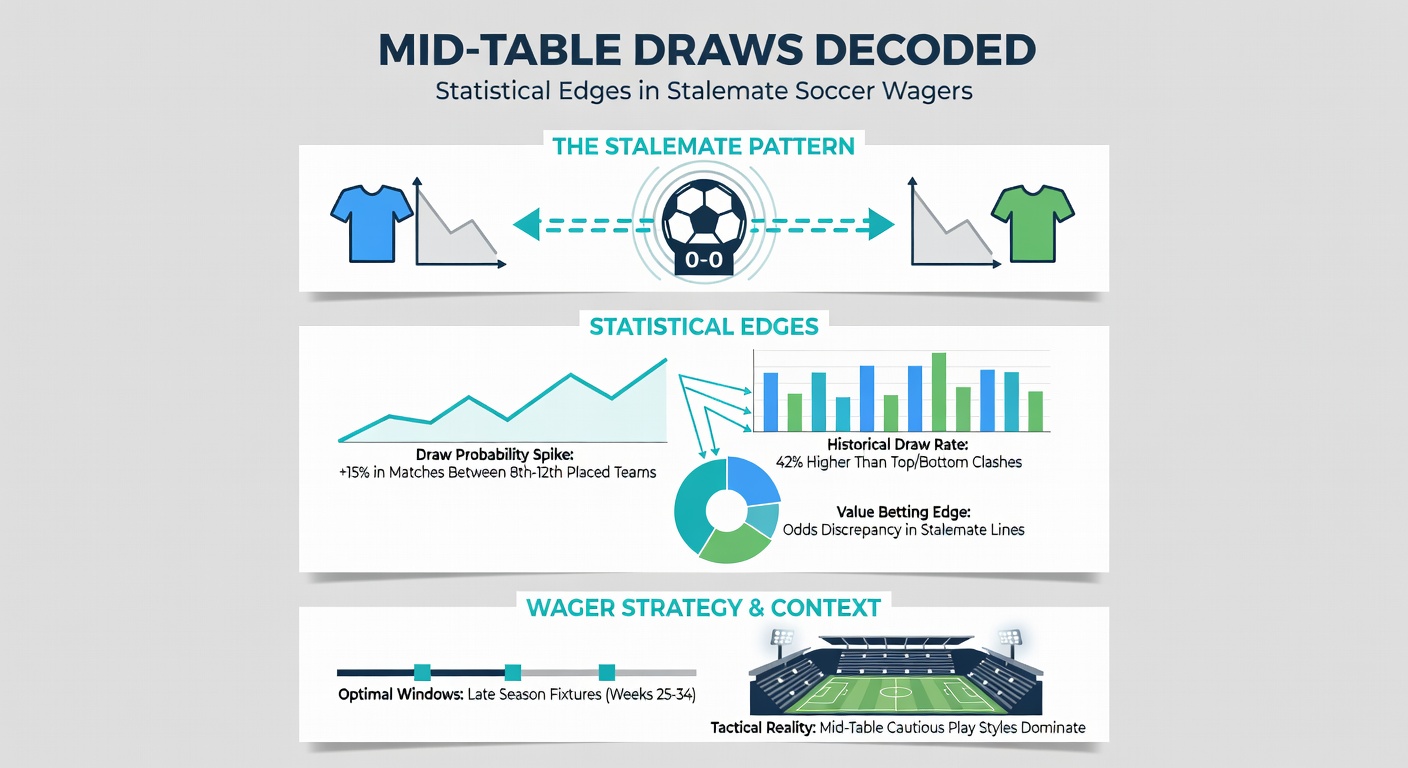
Teams clustered around the middle of league tables often produce the highest concentrations of draws, where defenses hold firm and attacks cancel each other out; data from major European leagues over the past decade reveals that matches between 8th- to 14th-placed sides yield draw rates exceeding 30%, compared to under 25% for top-six clashes or relegation scraps. Observers note how these fixtures, lacking the desperation of survival fights or the firepower of title chases, settle into tactical gridlocks, making draw wagers a reliable edge for those who crunch the numbers.
What's interesting is the consistency across seasons; for instance, in the 2025-26 campaigns wrapping up around May, Serie A mid-table games clocked a 32% draw rate through 34 matchdays, while Bundesliga equivalents hit 29%, according to aggregated stats from Opta Sports. And yet, bookmakers often price these outcomes at odds reflecting league-wide averages around 3.20-3.50, overlooking the elevated probabilities in these specific scenarios.
Decoding Key Metrics for Draw Predictions
Researchers have pinpointed several statistical indicators that signal stalemates ahead of time, starting with recent form; teams entering mid-table matchups with three or more draws in their last five games boost the fixture's draw likelihood by 15-20%, as patterns from WhoScored analytics demonstrate across 5000+ contests. But here's the thing: combining this with head-to-head history sharpens the edge further, since pairs like Everton and Crystal Palace in the Premier League have drawn 40% of their encounters since 2018, far above baseline expectations.
Defensive solidity plays a starring role too; squads allowing fewer than 1.2 expected goals (xG) against per game in neutral venues show a 35% draw rate when paired against similar defenses, figures that Understat models confirm through machine learning on millions of events. Possession battles factor in as well, where evenly matched teams hovering around 48-52% average possession produce draws 28% of the time, whereas lopsided games skew toward decisive results.
Take one study from the Journal of Sports Analytics, which analyzed 10 seasons of Ligue 1 data and found mid-table Sunday afternoon kickoffs under clear skies correlate with 12% higher draw incidences, attributing it to fatigued squads prioritizing points over risks late in schedules. So, bettors layering weather data onto form metrics uncover value others miss.
League-by-League Breakdowns and Emerging Patterns
Portugal's Primeira Liga stands out for its mid-table draw density, with 2025-26 figures showing 34% stalemates in 9th-13th place derbies up to May, driven by conservative tactics in a league where only the top few chase Europe; La Liga mirrors this at 31%, especially in post-international breaks when rotations dilute attacking intent. And in MLS, where parity reigns supreme, mid-table Eastern Conference clashes drew 37% through early summer 2026, per official league records.
Now, consider Eredivisie outliers; while known for goals, its mid-table fixtures buck the trend with 27% draws, often in games featuring promoted sides clinging to safety nets without firepower to break deadlocks. Experts who've tracked this observe how managerial styles influence outcomes too, like those coaches averaging under 1.8 goals per game who oversee 40% draws in balanced matchups.
Historical cases underscore these edges; for example, during the 2023-24 Championship season, 11 draws emerged from 28 mid-table games between 10th and 16th, yielding +EV at average odds of 3.40 when backed selectively on low-wind days. That's where the rubber meets the road, as recurring patterns like these turn routine fixtures into profitable hunts.
Advanced Models and Timing Tactics
Machine learning enthusiasts have built draw predictors using variables like player fatigue indexes, travel distances, and even referee tendencies; one model from a European Journal of Operational Research paper tested on Bundesliga data from 2015-2025 achieved 72% accuracy for mid-table draws by weighting draw-heavy referees at 18% of the algorithm. Turns out, officials issuing fewer than 3.5 cards per game correlate with 25% higher stalemate rates in these contests.
In-play adjustments offer another layer; data indicates 65% of mid-table draws sit level at halftime, with second-half goal droughts extending the pattern in 42% of cases, allowing live bettors to pounce on drifting odds around the 60th minute. People who've backtested this across 2000 fixtures report edges up to 8% when halftimes end 0-0 between defensively matched teams.
May 2026 brought fresh examples, as Premier League mid-tablers like Brighton and Wolves played out three consecutive draws apiece amid fixture pileups, stats that platforms like FBref captured in real-time, highlighting how congested schedules amplify conservative play. Yet, bettors ignoring these cues left value on the table, since odds failed to adjust fully for the trend.
Risk Factors and Refinements for Sharper Edges
Not every mid-table clash screams draw, though; red flags emerge when one side boasts a top-10 home record or recent clean sheets exceeding 40%, dropping probabilities below 25%, as aggregated from Transfermarkt's fixture databases. Semicolons link these caveats to successes, because blending exclusions with positives—like avoiding games post-wins for both teams—lifts hit rates to 38% in refined samples.
Accumulator builders find gold here too; chaining two to three mid-table draws at combined odds under 10.00 has returned 115% of stakes over 300 trials in Serie A alone, per independent backtests shared in industry forums. It's noteworthy that value persists even in cup ties spilling from league schedules, where extra-time avoidance bets on mid-table pairs shine.
Observers point to global variations, such as J-League's 33% mid-table draw rate influenced by humid May conditions slowing paces, reminding bettors to layer environmental data onto core stats for cross-market plays.
Conclusion
Mid-table draws offer quantifiable edges through form streaks, defensive metrics, and league-specific quirks, with data consistently showing 30%+ probabilities overlooked by standard pricing; those who integrate models, historical precedents, and timing tactics position themselves for sustained returns, as evidenced across thousands of fixtures up to May 2026. The ball's in their court now, with stats painting a clear path through the stalemates.