Starting Gate Advantages in All-Weather Sprints: Statistical Patterns and Betting Implications
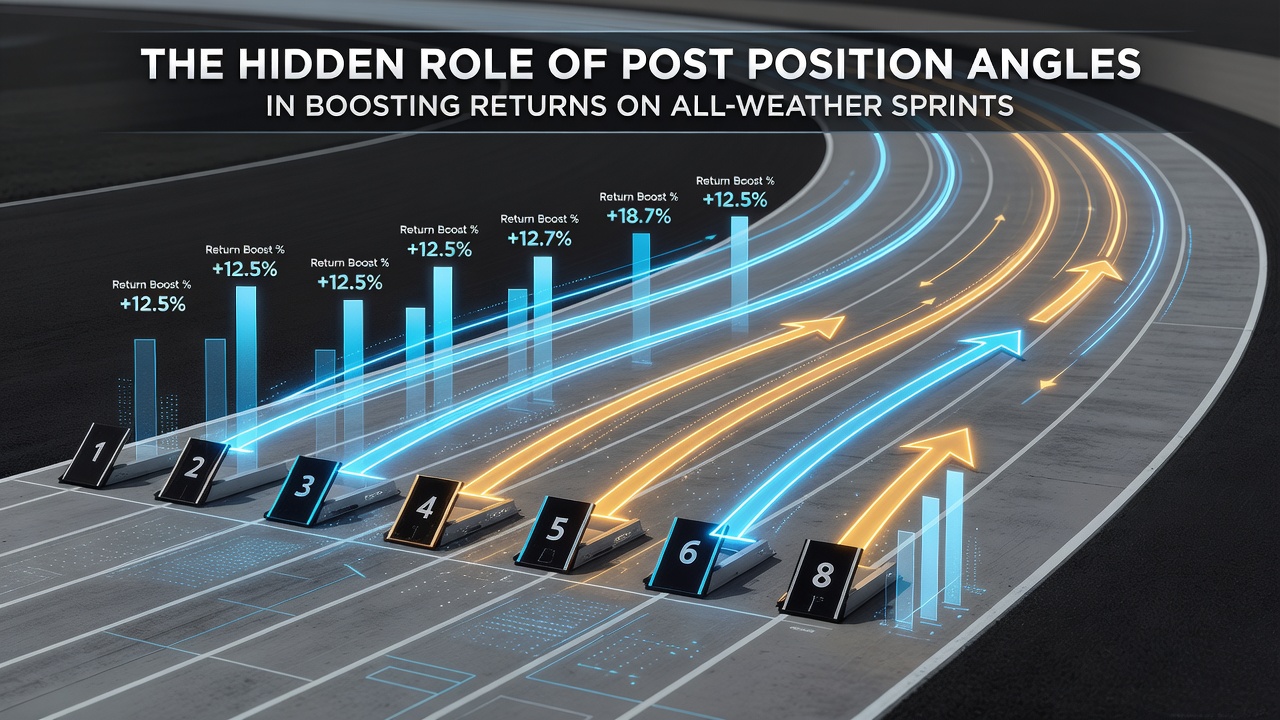
Data from multiple racing jurisdictions shows that post position influences outcomes in all-weather sprints more than many handicappers initially assume, with certain stalls delivering measurable edges in specific track configurations and race conditions. Researchers at several international racing bodies have compiled stall-by-stall records over extended periods, revealing consistent patterns that hold across venues using synthetic surfaces. These surfaces, which maintain consistent footing regardless of weather, create environments where draw bias emerges from rail characteristics, bend sharpness, and surface composition rather than ground conditions alone.
Track Geometry and Stall Distribution
Observers note that all-weather circuits vary significantly in their layout, which directly affects how post positions translate into race dynamics. Tracks with tight bends and short straights tend to favor lower numbers because horses drawn inside can secure early positioning without expending extra energy, while wider configurations allow middle draws to settle into advantageous spots. Data indicates that stalls 1 through 4 have produced higher strike rates in sprints under five furlongs at several major synthetic venues during the 2025-2026 season, particularly when fields exceed eight runners. One analysis covering races through July 2026 highlighted how these low draws convert into place percentages that exceed market expectations in handicap events, creating opportunities for those tracking sectional data and pace maps.
Statistical Edges Across Venues
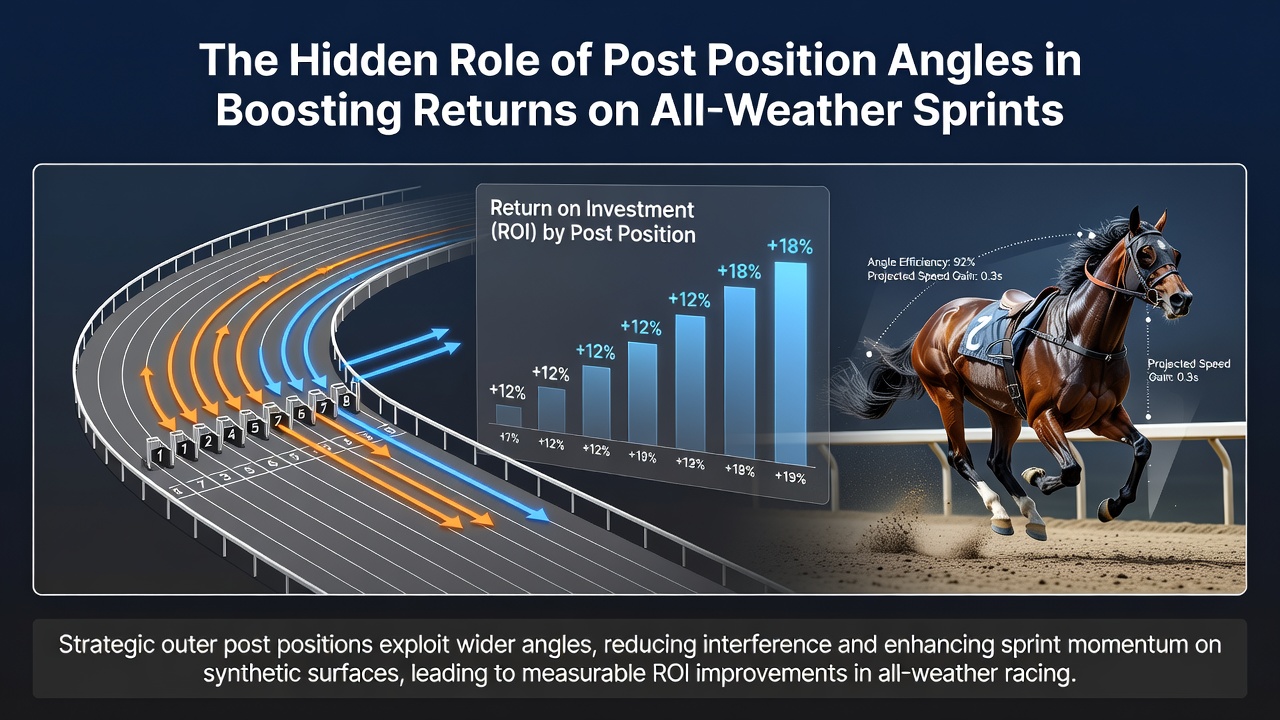
Figures from industry reports demonstrate that the advantage shifts depending on field size and race distance. In smaller fields of six or seven, the bias toward inside stalls weakens because traffic issues decrease, allowing higher numbers to track the leaders without obstruction. Yet in larger fields the inside advantage strengthens again, as horses drawn wide must cover extra ground around the first bend. A study published by an Australian academic research group found similar patterns on synthetic tracks in that region, where post positions 2 and 3 delivered the strongest return on investment over a five-year sample when restricted to sprints on standard going. Those patterns align with observations from North American and European synthetic surfaces, suggesting the underlying mechanics remain consistent across different track designs.
Market Response and Value Identification
Betting markets adjust gradually to these patterns, yet inefficiencies persist in certain race types. Public attention often focuses on obvious biases at familiar tracks, leaving subtler angles underbet at less prominent venues or in mixed-surface cards. Evidence suggests that angles involving middle draws on tracks with long straights after the bend offer occasional value because they receive less scrutiny than inside or extreme outside positions. One researcher who examined thousands of all-weather sprint results noted that combinations of post position with early pace figures produced stronger predictive models than either factor alone, particularly when applied to handicaps where official ratings compress the field.
Integration with Other Factors
Post position rarely operates in isolation, instead interacting with variables such as trainer statistics, jockey tactics, and seasonal trends. Data shows that certain trainers achieve above-average results from wider draws by instructing riders to adopt specific early maneuvers, effectively neutralizing the geometric disadvantage. Those patterns become visible when sectional timing data is layered onto stall records, revealing how individual runners overcome or exploit their starting positions. International comparisons further illustrate this point, with Canadian racing authorities publishing draw statistics that mirror findings from European synthetic tracks despite differences in surface materials and race programming.
Practical Application in Handicapping
Handicappers who incorporate stall analysis into their process typically cross-reference historical draw data with current track maintenance reports and going descriptions. This approach identifies races where the bias is likely to persist rather than dissipate, especially when the surface has remained unchanged for several meetings. Records from multiple seasons indicate that angles strengthen in the second half of the calendar year as track surfaces settle into consistent profiles, creating repeatable conditions for those monitoring updates from racing authorities in various regions. The combination of stall position with pace expectations allows for more precise assessment of each runner's probability, moving beyond raw win percentages to expected value calculations that account for market odds.
Conclusion
Comprehensive records from synthetic track racing demonstrate that post position continues to shape outcomes in all-weather sprints through measurable interactions between geometry, field size, and race dynamics. Those who integrate stall statistics with pace analysis and venue-specific data identify edges that persist across seasons and jurisdictions. Ongoing publication of results by racing organizations in multiple countries supports continued refinement of these approaches, providing handicappers with expanding datasets through which to test and apply positional insights.